One World
Nations Online
One World Nations Online |
|
Home  |
|
___ National Economic Accounts for Countries and Regions around the WorldCompared National Income Accounting in relation to the standards of living across countries.Comparison of the Gross National Income (GNI) of countries based on Purchasing Power Parity (PPP) percapita in international Dollars. List of countries and regions of the world by their GNI at purchasing power parity (PPP) per capita for one year (2005), in ascending order starting with the countries with the lowest GNI. For example, the comparable average income of a citizen of Malawi is 596 Dollar yearly, the average income of a citizen of Argentina is 13,153 Dollar in a year, and a citizen of the United States has an average income of 41,557 Dollar yearly. To make it more clear a resident of Thailand has an income of $3,760 that is ten times more than that of a resident in Afghanistan who has a yearly income of $310, but the Thai's income is more than ten time less than the income of a resident of Spain with a yearly average income of $32,120. This are real figures - not fictional. (Data World Bank 2007) 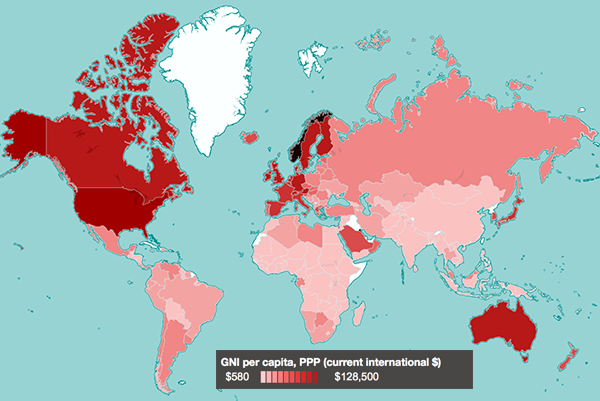 50 shades of income inequality, the map shows the high income countries in dark shades, and the poor rest of the world in dusky pink (in 2011). Source: World Bank. Definition: The Gross National Income (GNI) comprises the total value of currently produced final goods and services produced by the domestic economy of a country, measured within a given period of time, usually a year. (a close value is Gross National Product (GNP). Purchasing Power Parity is a method of measuring the relative purchasing power of different countries currencies over the same types of goods and services, despite differential rates of inflation. PPP allows to make more accurate comparisons of standards of living across countries, because goods and services may cost more in one country than in another. The International Dollar is a hypothetical unit of currency that has the same purchasing power that the U.S. dollar has in the United States at a given point in time. | |
| Bookmark/share this page |
|
| Country List - Economies by Gross National Income at Purchasing-Power-Parity per Capita and Year. | ||||
| Country | Region | GNI per capita | ||
| 1 | Timor-Leste | South-East Asia | *400 | |
| 2 | Malawi | Eastern Africa | 596 | |
| 3 | Somalia | Eastern Africa | *600 | |
| 4 | Democratic Republic of the Congo | Middle Africa | 675 | |
| 5 | Tanzania | Eastern Africa | 720 | |
| 6 | Yemen | Middle East | 745 | |
| 7 | Burundi | Eastern Africa | 753 | |
| 8 | Afghanistan | Central Asia | *800 | |
| 9 | Guinea-Bissau | Western Africa | 856 | |
| 10 | Ethiopia | Eastern Africa | 859 | |
| 11 | Niger | Western Africa | 896 | |
| 12 | Liberia | Western Africa | *900 | |
| 13 | Sierra Leone | Western Africa | 901 | |
| 14 | Madagascar | Eastern Africa | 911 | |
| 15 | Zambia | Eastern Africa | 911 | |
| 16 | Eritrea | Eastern Africa | 917 | |
| 17 | Mali | WesternAfrica | 1 084 | |
| 18 | Tuvalu | Polynesia | *1 100 | |
| 19 | Kenya | Africa | 1 125 | |
| 20 | Benin | Western Africa | 1 147 | |
| 21 | Central African Republic | Middle Africa | 1 163 | |
| 22 | Nigeria | Western Africa | 1 188 | |
| 23 | Burkina Faso | Western Africa | 1 326 | |
| 24 | Mozambique | Eastern Africa | 1 335 | |
| 25 | Tajikistan | Central Asia | 1 373 | |
| 26 | Republic of the Congo | Middle Africa | 1 379 | |
| 27 | Korea (North) | Eastern Asia | *1 400 | |
| 28 | Myanmar (Burma) | South-East Asia | 1 417 | |
| 29 | Rwanda | Eastern Africa | 1 431 | |
| 30 | Nepal | South-Central Asia | 1 471 | |
| 31 | Côte d'Ivoire | West Africa | 1 475 | |
| 32 | Togo | Western Africa | 1 600 | |
| 33 | Marshall Islands | Micronesia | *1 600 | |
| 34 | Haiti | Caribbean | 1 614 | |
| 35 | São Tomé and Príncipe | Middle Africa | 1 638 | |
| 36 | Comoros | Eastern Africa | 1 717 | |
| 37 | Chad | Middle Africa | 1 744 | |
| 38 | Uganda | Eastern Africa | 1 817 | |
| 39 | Uzbekistan | Central Asia | 1 834 | |
| 40 | Senegal | Western Africa | 1 914 | |
| 41 | Solomon Islands | Melanesia | 1 922 | |
| 42 | Djibouti | Eastern Africa | 1 957 | |
| 43 | Guinea | Western Africa | 1 986 | |
| 44 | Bangladesh | South-Central Asia | 1 998 | |
| 45 | The Gambia | Western Africa | 1 999 | |
| 46 | Federated States of Micronesia | Micronesia | *2 000 | |
| 47 | Mongolia | North-East Asia | 2 046 | |
| 48 | Laos | South-East Asia | 2 049 | |
| 49 | Kyrgyzstan | Central Asia | 2 061 | |
| 50 | Cambodia | South-East Asia | 2 116 | |
| 51 | Lesotho | Southern Africa | 2 163 | |
| 52 | Moldova | Eastern Europe | 2 262 | |
| 53 | Cameroon | Middle Africa | 2 284 | |
| 54 | Mauritania | North Western Africa | 2 307 | |
| 55 | Zimbabwe | South-Eastern Africa | 2 413 | |
| 56 | Papua New Guinea | Melanesia | 2 414 | |
| 57 | Sudan | North Africa | 2 417 | |
| 58 | Pakistan | Central Asia | 2 567 | |
| 59 | Kiribati | Micronesia | 2 591 | |
| 60 | Ghana | Western Africa | 2 601 | |
| 61 | Nicaragua | Central America | 2 779 | |
| 62 | Viet Nam | South-East Asia | 2 782 | |
| 63 | Honduras | Central America | 2 793 | |
| 64 | Angola | Middle Africa | 2 829 | |
| 65 | Cuba | Caribbean | *3 000 | |
| 66 | Georgia | Western Asia | 3 038 | |
| 67 | Bolivia | South America | 3 049 | |
| 68 | India | South Asia | 3 262 | |
| 69 | Bhutan | South-Central Asia | 3 330 | |
| 70 | Vanuatu | Melanesia | 3 397 | |
| 71 | Iraq | Middle East | 3 500 | |
| 72 | Indonesia | South-East Asia | 3 853 | |
| 73 | Syria | Middle East | 3 871 | |
| 74 | Ecuador | South America | 4 010 | |
| 75 | Armenia | Western Asia | 4 048 | |
| 76 | Guatemala | Central America | 4 136 | |
| 77 | Sri Lanka | South Asia | 4 145 | |
| 78 | Egypt | North Africa | 4 282 | |
| 79 | Morocco | North Africa | 4 444 | |
| 80 | Jamaica | Caribbean | 4 471 | |
| 81 | Azerbaijan | Central Asia | 4 500 | |
| 82 | El Salvador | Central America | 4 525 | |
| 83 | Jordan | Middle East | 4 615 | |
| 84 | Paraguay | America | 4 663 | |
| 85 | Guyana | South America | 4 685 | |
| 86 | Philippines | South-East Asia | 4 770 | |
| 87 | Nauru | Micronesia | *5 000 | |
| 88 | Swaziland | Southern Africa | 5 181 | |
| 89 | Serbia and Montenegro | Southern Europe | 5 204 | |
| 90 | Albania | Southern Europe | 5 323 | |
| 91 | Saint Lucia | Caribbean | 5 516 | |
| 92 | Peru | South America | 5 594 | |
| 93 | Venezuela | South America | 5 801 | |
| 94 | Bosnia and Herzegovina | Southern Europe | 5 827 | |
| -- | Réunion (French overseas department) | Eastern Africa | *6 000 | |
| 95 | Suriname | South America | 6 025 | |
| 96 | China (Mainland) | East Asia | 6 193 | |
| 97 | Lebanon | Middle East | 6 205 | |
| 98 | Dominica | Caribbean | 6 250 | |
| 99 | Fiji | Melanesia | 6 282 | |
| 100 | Cape Verde | Western Africa | 6 287 | |
| 101 | Samoa | Polynesia | 6 390 | |
| 102 | Namibia | West-South Africa | 6 658 | |
| 103 | Saint Vincent and the Grenadines | Caribbean | 6 679 | |
| 104 | Gabon | Middle Africa | 6 977 | |
| 105 | Dominican Republi | Caribbean | 7 055 | |
| 106 | Algeria | North Africa | 7 095 | |
| 107 | Ukraine | Eastern Europe | 7 182 | |
| 108 | Colombia | South America | 7 303 | |
| 109 | Panama | Central America | 7 327 | |
| 110 | Belize | Central America | 7 635 | |
| 111 | Maldives | South Asia | 7 640 | |
| 112 | Tonga | Polynesia | 7 706 | |
| 113 | Republic of Macedonia | Southern Europe | 7 749 | |
| 114 | Turkmenistan | Central Asia | 7 854 | |
| 115 | Turkey | Europe/Asia | 7 958 | |
| 116 | Iran | Central Asia | 8 065 | |
| 117 | Belarus | Eastern Europe | 8 186 | |
| 118 | Tunisia | North Africa | 8 223 | |
| 119 | Kazakhstan | Central Asia | 8 252 | |
| 120 | Romania | Eastern Europe | 8 258 | |
| -- | French Guiana | South America | *8 300 | |
| 121 | Thailand | South-East Asia | 8 542 | |
| 122 | Grenada | Caribbean | 8 608 | |
| 123 | Brazil | South America | 8 745 | |
| 124 | Palau (note: includes US subsidy) | Micronesia | *9 000 | |
| 125 | Bulgaria | Southern Europe | 9 205 | |
| 126 | Uruguay | South America | 9 619 | |
| 127 | Mexico | North America | 10 090 | |
| 128 | Costa Rica | Central America | 10 316 | |
| 129 | Botswana | Southern Africa | 10 866 | |
| 130 | South Africa | South Africa | 11 035 | |
| 131 | Malaysia | South-East Asia | 11 160 | |
| 132 | Russian Federation | Northern Asia | 11 209 | |
| 133 | Libya | North Africa | 11 354 | |
| 134 | Chile | South America | 11 537 | |
| 135 | Antigua and Barbuda | Caribbean | 11 604 | |
| 136 | Seychelles | Eastern Africa | 12 135 | |
| 137 | Croatia (Hrvatska) | Southern Europe | 12 364 | |
| 138 | Latvia | Northern Europe | 12 886 | |
| 139 | Mauritius | Eastern Africa | 13 029 | |
| 140 | Saudi Arabia | Middle East | 13 123 | |
| 141 | Argentina | South America | 13 153 | |
| 142 | Poland | Eastern Europe | 13 275 | |
| 143 | Trinidad and Tobago | Caribbean | 13 958 | |
| 144 | Lithuania | Northern Europe | 14 198 | |
| -- | New Caledonia | Melanesia | *15 000 | |
| 145 | Saint Kitts and Nevis | Caribbean | 15 050 | |
| 146 | Slovakia | Eastern Europe | 16 110 | |
| 147 | Kuwait | Middle East | 16 297 | |
| 148 | Oman | Middle East | 16 300 | |
| 149 | Estonia | Northern Europe | 16 461 | |
| 150 | Hungary | Eastern Europe | 16 627 | |
| 151 | Barbados | Caribbean | 17 170 | |
| -- | French Polynesia Tahiti (France) | Polynesia | *17 500 | |
| -- | Puerto Rico (USA) | Caribbean | *17 700 | |
| 152 | The Bahamas | Caribbean | 19 139 | |
| -- | Macau (SAR, China) | Eastern Asia | *19 400 | |
| 153 | Czech Republic | Eastern Europe | 19 475 | |
| 154 | Bahrain | Middle East | 19 748 | |
| 155 | Portugal | Southern Europe | 19 949 | |
| 156 | Malta | Southern Europe | 20 015 | |
| 157 | Cyprus | Europe/Asia | 20 669 | |
| 158 | Greece | Southern Europe | 21 529 | |
| 159 | Slovenia | Southern Europe | 21 695 | |
| 160 | South Korea | East Asia | 22 543 | |
| 161 | Israel | Middle East | 22 944 | |
| 162 | Equatorial Guinea | Middle Africa | 23 154 | |
| 163 | United Arab Emirates | Middle East | 23 723 | |
| -- | Netherlands Antilles (Netherlands) | Caribbean | 23 770 | |
| 164 | Spain | Southern Europe | 24 803 | |
| 165 | New Zealand | Oceania | 24 805 | |
| 166 | Brunei Darussalam | South-East Asia | 24 826 | |
| 167 | Liechtenstein | Western Europe | *25 000 | |
| 168 | Andorra | Southern Europe | *26 800 | |
| -- | European Union | 26 900 | ||
| 169 | Monaco | Western Europe | 27 000 | |
| 170 | Taiwan (Republic of China) | East Asia | 27 122 | |
| 171 | Singapore | South-East Asia | 28 228 | |
| 172 | France | Western Europe | 29 203 | |
| 173 | Italy | Southern Europe | 29 414 | |
| 174 | Sweden | Northern Europe | 29 537 | |
| 175 | Qatar | Middle East | 29 607 | |
| 176 | Germany | Western Europe | 30 150 | |
| 177 | United Kingdom | Northern Europe | 30 309 | |
| 178 | Netherlands | Western Europe | 30 363 | |
| 179 | Finland | Northern Europe | 30 818 | |
| 180 | Australia | Oceania | 31 020 | |
| 181 | Japan | East Asia | 31 384 | |
| 182 | Belgium | Western Europe | 31 549 | |
| -- | Hong Kong (SAR, China) | Asia | 32 292 | |
| 183 | Austria | Western Europe | 32 962 | |
| 184 | Switzerland | Western Europe | 33 168 | |
| 185 | Canada | North America | 34 444 | |
| 186 | San Marino | Southern Europe | *34 600 | |
| 187 | Denmark | Northern Europe | 34 718 | |
| 188 | Iceland | Northern Europe | 35 686 | |
| -- | Bermuda (overseas territory of the UK) | North America | *36 000 | |
| 189 | Ireland | Northern Europe | 40 003 | |
| 190 | United States | North America | 41 557 | |
| 191 | Norway | Northern Europe | 41 941 | |
| 192 | Luxembourg | Western Europe | 66 821 | |
Sources: IMF -- International Monetary Fund, World Economic Outlook Database, April 2005 (*) CIA The World Factbook (covers countries not mentioned by the IMF, information may refer to 2004 or earlier.) Slightly different figures you will find at Country Economies Classification of The World Bank Group |
||||
| Related Categories: How indepted are countries. | Related Consumer Information
|
|||
One World - Nations Online .:. let's care for this planet Made to improve cross-cultural understanding, global awareness, and cultivating a cosmopolitan consciousness. |
 |
|
| Site Map
| Information Sources | Disclaimer: Privacy Policy, etc. | Contact:
[email protected]
Copyright © 1998-2017 :: nationsonline.org | ||