One World
Nations Online
One World Nations Online |
|
Home  |
___ The Human Development Index 2011 - going beyond incomeNorway, Australia and the Netherlands lead the Human Development Index (HDI) rankings in 2011, while the Democratic Republic of the Congo (DRC), Niger and Burundi are at the bottom.Each year since 1990 the Human Development Report has published the Human Development Index (HDI) which was introduced as an alternative to conventional measures of national development. The HDI represents a broader definition of well-being and provides a composite measure of three basic dimensions of human development: health, education and income. The latest HDI report is from 2011 with emphasis on Sustainability and Equity, titled: A Better Future for All. The three Human Development Indicators are: 1. Life Expectancy Index (LEI): Life expectancy at birth (in years); 2. Education Index (EI) Mean years of schooling (in years), and Expected years of schooling (in years), and 3. Income Index (II): Per capita income (PPP $). Below is the list of countries with a "Very High Human Development" including Barbados (rank 47), followed by three countries with "High Human Development". Definitions: Human Development Index (HDI): A composite index measuring average achievement in three basic dimensions of human development-a long and healthy life, knowledge and a decent standard of living. Life expectancy at birth: Number of years a newborn infant could expect to live if prevailing patterns of age-specific mortality rates at the time of birth stay the same throughout the infant's life. Mean years of schooling: Average number of years of education received by people ages 25 and older, converted from education attainment levels using official durations of each level. Expected years of schooling: Number of years of schooling that a child of school entrance age can expect to receive if prevailing patterns of age-specific enrolment rates persist throughout the child's life. Gross national income (GNI) per capita: Aggregate income of an economy generated by its production and its ownership of factors of production, less the incomes paid for the use of factors of production owned by the rest of the world, converted to international dollars using purchasing power parity (PPP) rates, divided by midyear population. GNI per capita rank minus HDI rank: Difference in rankings by GNI per capita and by the HDI. A negative value means that the country is better ranked by GNI than by the HDI. Nonincome HDI: Value of the HDI computed from the life expectancy and education indicators only. For comparsion, the third table is the UN Human Development Report 2002 updated 2004. |
Human Development Index - Top 50 Countries with high human development in 2011 |
|||||||||
| HDI rank | Country | Human Development Index (HDI) | Life expectancy at birth | Mean years of schooling | Expected years of schooling | Gross national income (GNI) per capita | GNI per capita rank minus HDI | Nonincome HDI |
|
| 1 | Norway | 0.943 | 81.1 | 12.6 | 17.3 | 47,557 | 6 | 0.975 | |
| 2 | Australia | 0.929 | 81.9 | 12.0 | 18.0 | 34,431 | 16 | 0.979 | |
| 3 | Netherlands | 0.910 | 80.7 | 11.6 | 16.8 | 36,402 | 9 | 0.944 | |
| 4 | United States | 0.910 | 78.5 | 12.4 | 16.0 | 43,017 | 6 | 0.931 | |
| 5 | New Zealand | 0.908 | 80.7 | 12.5 | 18.0 | 23,737 | 30 | 0.978 | |
| 6 | Canada | 0.908 | 81.0 | 12.1 | 16.0 | 35,166 | 10 | 0.944 | |
| 7 | Ireland | 0.908 | 80.6 | 11.6 | 18.0 | 29,322 | 19 | 0.959 | |
| 8 | Liechtenstein | 0.905 | 79.6 | 10.3 | 14.7 | 83,717 | –6 | 0.877 | |
| 9 | Germany | 0.905 | 80.4 | 12.2 | 15.9 | 34,854 | 8 | 0.940 | |
| 10 | Sweden | 0.904 | 81.4 | 11.7 | 15.7 | 35,837 | 4 | 0.936 | |
| 11 | Switzerland | 0.903 | 82.3 | 11.0 | 15.6 | 39,924 | 0 | 0.926 | |
| 12 | Japan | 0.901 | 83.4 | 11.6 | 15.1 | 32,295 | 11 | 0.940 | |
| 13 | Hong Kong, China (SAR) | 0.898 | 82.8 | 10.0 | 15.7 | 44,805 | –4 | 0.910 | |
| 14 | Iceland | 0.898 | 81.8 | 10.4 | 18.0 | 29,354 | 11 | 0.943 | |
| 15 | Korea, Republic of | 0.897 | 80.6 | 11.6 | 16.9 | 28,230 | 12 | 0.945 | |
| 16 | Denmark | 0.895 | 78.8 | 11.4 | 16.9 | 34,347 | 3 | 0.926 | |
| 17 | Israel | 0.888 | 81.6 | 11.9 | 15.5 | 25,849 | 14 | 0.939 | |
| 18 | Belgium | 0.886 | 80.0 | 10.9 | 16.1 | 33,357 | 2 | 0.914 | |
| 19 | Austria | 0.885 | 80.9 | 10.8 | 15.3 | 35,719 | –4 | 0.908 | |
| 20 | France | 0.884 | 81.5 | 10.6 | 16.1 | 30,462 | 4 | 0.919 | |
| 21 | Slovenia | 0.884 | 79.3 | 11.6 | 16.9 | 24,914 | 11 | 0.935 | |
| 22 | Finland | 0.882 | 80.0 | 10.3 | 16.8 | 32,438 | 0 | 0.911 | |
| 23 | Spain | 0.878 | 81.4 | 10.4 | 16.6 | 26,508 | 6 | 0.920 | |
| 24 | Italy | 0.874 | 81.9 | 10.1 | 16.3 | 26,484 | 6 | 0.914 | |
| 25 | Luxembourg | 0.867 | 80.0 | 10.1 | 13.3 | 50,557 | –20 | 0.854 | |
| 26 | Singapore | 0.866 | 81.1 | 8.8 | 14.4 e | 52,569 | –22 | 0.851 | |
| 27 | Czech Republic | 0.865 | 77.7 | 12.3 | 15.6 | 21,405 | 14 | 0.917 | |
| 28 | United Kingdom | 0.863 | 80.2 | 9.3 | 16.1 | 33,296 | –7 | 0.879 | |
| 29 | Greece | 0.861 | 79.9 | 10.1 | 16.5 | 23,747 | 5 | 0.902 | |
| 30 | United Arab Emirates | 0.846 | 76.5 | 9.3 | 13.3 | 59,993 | –27 | 0.813 | |
| 31 | Cyprus | 0.840 | 79.6 | 9.8 | 14.7 | 24,841 | 2 | 0.866 | |
| 32 | Andorra | 0.838 | 80.9 | 10.4 | 11.5 | 36,095 | –19 | 0.836 | |
| 33 | Brunei Darussalam | 0.838 | 78.0 | 8.6 | 14.1 | 45,753 | –25 | 0.819 | |
| 34 | Estonia | 0.835 | 74.8 | 12.0 | 15.7 | 16,799 | 13 | 0.890 | |
| 35 | Slovakia | 0.834 | 75.4 | 11.6 | 14.9 | 19,998 | 8 | 0.875 | |
| 36 | Malta | 0.832 | 79.6 | 9.9 | 14.4 | 21,460 | 4 | 0.866 | |
| 37 | Qatar | 0.831 | 78.4 | 7.3 | 12.0 | 107,721 | –36 | 0.757 | |
| 38 | Hungary | 0.816 | 74.4 | 11.1 | 15.3 | 16,581 | 11 | 0.862 | |
| 39 | Poland | 0.813 | 76.1 | 10.0 | 15.3 | 17,451 | 7 | 0.853 | |
| 40 | Lithuania | 0.810 | 72.2 | 10.9 | 16.1 | 16,234 | 10 | 0.853 | |
| 41 | Portugal | 0.809 | 79.5 | 7.7 | 15.9 | 20,573 | 1 | 0.833 | |
| 42 | Bahrain | 0.806 | 75.1 | 9.4 | 13.4 | 28,169 | –14 | 0.806 | |
| 43 | Latvia | 0.805 | 73.3 | 11.5 | 15.0 | 14,293 | 12 | 0.857 | |
| 44 | Chile | 0.805 | 79.1 | 9.7 | 14.7 | 13,329 | 14 | 0.862 | |
| 45 | Argentina | 0.797 | 75.9 | 9.3 | 15.8 | 14,527 | 9 | 0.843 | |
| 46 | Croatia | 0.796 | 76.6 | 9.8 | 13.9 | 15,729 | 5 | 0.834 | |
| 47 | Barbados | 0.793 | 76.8 | 9.3 | 13.4 | 17,966 | –3 | 0.818 | |
| 48 | Uruguay | 0.783 | 77.0 | 8.5 | 15.5 | 13,242 | 12 | 0.828 | |
| 49 | Palau | 0.782 | 71.8 | 12.1 | 14.7 | 9,744 | 29 | 0.853 | |
| 50 | Romania | 0.781 | 74.0 | 10.4 | 14.9 | 11,046 | 20 | 0.841 | |
| Source: UN Human Development Report 2011 - Download Human Development Report 2011 | |||||||||
Inequality-adjusted HDI 2011The 2010 Report introduced the Inequality-adjusted HDI (IHDI), a measure of the level of human development of people in a society that accounts for inequality (in countries with inequality in the distribution of health, education and income. It includes economic inequality which is also known as the gap between rich and poor).The IHDI is the actual level of human development (taking into account inequality), while the HDI can be viewed as an index of the potential human development that could be achieved if there is no inequality. |
|||||||||
| Country | IHDI | HDI | Loss (%) |
Rank change |
|||
|---|---|---|---|---|---|---|---|
| 1 | Norway | 0.890 | 0.943 | 5.6 | 0 | ||
| 2 | Australia | 0.856 | 0.929 | 7.9 | 0 | ||
| 3 | Sweden | 0.851 | 0.904 | 5.9 | 5 | ||
| 4 | Netherlands | 0.846 | 0.910 | 7.0 | -1 | ||
| 5 | Iceland | 0.845 | 0.898 | 5.9 | 5 | ||
| 6 | Ireland | 0.843 | 0.908 | 7.2 | 0 | ||
| 7 | Germany | 0.842 | 0.905 | 6.9 | 0 | ||
| 8 | Denmark | 0.842 | 0.895 | 6.0 | 4 | ||
| 9 | Switzerland | 0.840 | 0.903 | 7.0 | 0 | ||
| 10 | Slovenia | 0.837 | 0.884 | 5.3 | 7 | ||
| 11 | Finland | 0.833 | 0.882 | 5.6 | 7 | ||
| 12 | Canada | 0.829 | 0.908 | 8.7 | -7 | ||
| 13 | Czech Republic | 0.821 | 0.865 | 5.0 | 9 | ||
| 14 | Austria | 0.820 | 0.885 | 7.4 | 1 | ||
| 15 | Belgium | 0.819 | 0.886 | 7.6 | -1 | ||
| 16 | France | 0.804 | 0.884 | 9.1 | 0 | ||
| 17 | Spain | 0.799 | 0.878 | 8.9 | 2 | ||
| 18 | Luxembourg | 0.799 | 0.867 | 7.8 | 3 | ||
| 19 | United Kingdom | 0.791 | 0.863 | 8.4 | 4 | ||
| 20 | Slovakia | 0.787 | 0.834 | 5.7 | 7 | ||
| 21 | Israel | 0.779 | 0.888 | 12.3 | -8 | ||
| 22 | Italy | 0.779 | 0.874 | 10.9 | -2 | ||
| 23 | United States | 0.771 | 0.910 | 15.3 | -19 | ||
| 24 | Estonia | 0.769 | 0.835 | 7.9 | 2 | ||
| 25 | Hungary | 0.759 | 0.816 | 7.0 | 3 | ||
| 26 | Greece | 0.756 | 0.861 | 12.2 | -2 | ||
| 27 | Cyprus | 0.755 | 0.840 | 10.1 | -2 | ||
| 28 | South Korea | 0.749 | 0.897 | 16.5 | -17 | ||
| 29 | Poland | 0.734 | 0.813 | 9.7 | 0 | ||
| 30 | Lithuania | 0.730 | 0.810 | 9.8 | 0 |
|
|
The Human Development Index 2002Human development is first and foremost about allowing people to lead the kind of life they choose - and providing them with the tools and opportunities to make those choices. Human development is about much more than the rise or fall of national incomes. It is about creating an environment in which people can develop their full potential and lead productive, creative lives in accord with their needs and interests. People are the real wealth of nations. Development is thus about expanding the choices people have to lead lives that they value. And it is thus about much more than economic growth, which is only a means - if a very important one - of enlarging people's choices. Fundamental to enlarging these choices is building human capabilities - the range of things that people can do or be in life. The most basic capabilities for human development are to lead long and healthy lives, to be knowledgeable, to have access to the resources needed for a decent standard of living and to be able to participate in the life of the community. Without these, many choices are simply not available, and many opportunities in life remain inaccessible. (cited from UN Human Development Report 2004) Below you will find the chart of the Human Development Index (HDI) about the world's nations state of developing. The Index, published annually by the UN, is a summary measure of human development. It measures the average achievements in a country in three basic dimensions of human development: |
||||||||||||||||||||||||||||||||||||||||||||||||||||||||||||||||||||||||||||||||||||||||||||||||||||||||||||||||||||||||||||||||||||||||||||||||||||||||||||||||||||||||||||||||||||||||||||||||||||||||||||||||||||||||||||||||||||||||||||||||||||||||||||||||||||||||||||||||||||||||||||||||||||||||||||||||||||||||||||||||||||||||||||||||||||||||||||||||||||||||||||
as measured by life expectancy at birth. as measured by the adult literacy rate (with two-thirds weight) and the combined primary, secondary and tertiary gross enrolment ratio (with one-third weight). as measured by GDP per capita* (PPP US$). * Gross Domestic Product, the value of all goods and services produced in the economy divided by the population. Each year, countries are ranked according to these measures. |
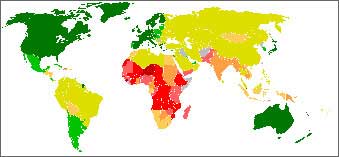 Worldmap of Human Development Index 2018 (click to enlarge) |
|||||||||||||||||||||||||||||||||||||||||||||||||||||||||||||||||||||||||||||||||||||||||||||||||||||||||||||||||||||||||||||||||||||||||||||||||||||||||||||||||||||||||||||||||||||||||||||||||||||||||||||||||||||||||||||||||||||||||||||||||||||||||||||||||||||||||||||||||||||||||||||||||||||||||||||||||||||||||||||||||||||||||||||||||||||||||||||||||||||||||||
Human Development Index - Top 30 Countries with high human development in 2002 |
||||||||||||||||||||||||||||||||||||||||||||||||||||||||||||||||||||||||||||||||||||||||||||||||||||||||||||||||||||||||||||||||||||||||||||||||||||||||||||||||||||||||||||||||||||||||||||||||||||||||||||||||||||||||||||||||||||||||||||||||||||||||||||||||||||||||||||||||||||||||||||||||||||||||||||||||||||||||||||||||||||||||||||||||||||||||||||||||||||||||||||
|
||||||||||||||||||||||||||||||||||||||||||||||||||||||||||||||||||||||||||||||||||||||||||||||||||||||||||||||||||||||||||||||||||||||||||||||||||||||||||||||||||||||||||||||||||||||||||||||||||||||||||||||||||||||||||||||||||||||||||||||||||||||||||||||||||||||||||||||||||||||||||||||||||||||||||||||||||||||||||||||||||||||||||||||||||||||||||||||||||||||||||||
| Related Categories: 2011-2012, list of countries with a variety of indicators of their financial stability or instability. 159 nations surveyed in 2005 Corruption Perceptions Index. Third World Countries by various categories. Index of countries according to their respect for press freedom. For in-depth information about the report please go to: United Nations Human Development Report Cultural Liberty in Today's Diverse World. Country Profiles and International Human Development Indicators |
|
One World - Nations Online .:. let's care for this planet Promote that every nation assumes responsibility for our world. Nations Online Project is made to improve cross-cultural understanding and global awareness. More signal - less NOISE |
| Site Map
| Information Sources | Disclaimer | Copyright © 1998-2024:: nationsonline.org |